Logs And Performance
For detailed documentation, check this: logging_library and performance_monitoring
About Logging
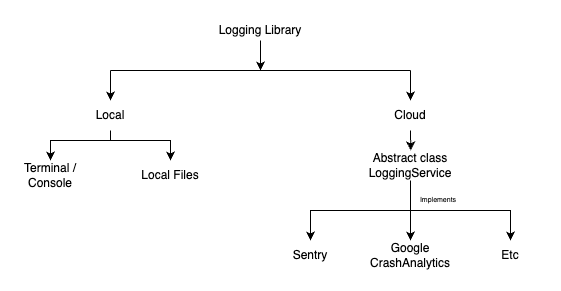
Logging library which handles cloud (e.g. sentry, crashanalytics) and local (e.g. Console/Terminal and Local Files For Device) Logs.
tip Cloud logging services
- As of now we have implemented Sentry to log and measure performance. Any other service is not available yet. To setup Sentry please check this.
- You can check out more details about it here: Sentry and Performance
- Also to enable sentry; developer will have to pass
sentryConfigin environment.
- So developer should never use individual service in their application, they should always use Logging library for logging any kind of content.
- To setup Sentry please check this.
Use cases
- To easily log content on cloud
- To easily add another cloud logging service
- To log transactions. e.g. I want to measure and log time of an api call
- To see formatted (prettier) objects in the console easily readable by the human eye
- To easily differentiate between different kinds of events.
Log types
Currently, our logs are of six types.
- log
- info
- success
- warning
- exception
- transaction
For Local Logs: Different types will print logs in different colors. the log will be in grey, info in blue, success in green, warning in yellow, and exception will be in red.
How to use
Call static methods of the Log class to log the events.
Log.log("Log");
Log.info("info");
Log.success("success");
Log.warning("warning");
try {
  // code snippet
} catch (error, stackTrace){
  Log.exception(error, stackTrace: stackTrace);
}
Log Transactions
When developer wants to measure performance of different operations they can use logTransaction funtion. Where developer will have to pass operation for which they wants to log as execute argument. e.g. API send receive requests, getting a file from local storage and parsing data, processing huge data, search queries, etc.
Log.logTransaction(
  execute: () async => {},
  details: const TransactionDetails(
    name: 'idle transaction',
    operation: 'idle',
  ),
);
Log.logTransaction(
  execute: Api.ajax('api.vaah.dev'),
  details: const TransactionDetails(
    name: 'get root route of vaah api',
    operation: 'read',
  ),
);
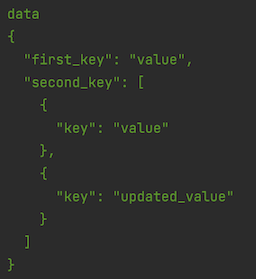
To print data, as argument pass the data
Map<String, dynamic> data = {
  "first_key": "value",
  "second_key": [
    {"key": "value"},
    {"key": "updated_value"},
  ],
};
Log.info('data', data: data);
Output:
You can disable local and cloud logging for specific log
Log.exception('exception', disableLocalLogging: true);
Log.info('log', disableCloudLogging: true);
For exception you can pass two extra parameters: stackTrace and hint
catch (error, stackTrace){
    Log.exception(
        error,
        stackTrace: stackTrace,
        hint: 'The exception is caught in ---',
    )
}
About Performance
Use cases
- To enable/ disable all kind of tracking, switch
enableAutoPerformanceTracing - Record cold startup time and warm startup time
- Observe Navigation
- Capture User Interactions
- Capture Assets Performance
- Observe transactions
- Record Slow and Frozen frames (Yet to implement)
Configuration
- To configure sentry for your project you just have to pass sentryConfig in environment config.
- Check this video for, how to get config values.
- To disable all kind of tracing set
enableAutoPerformanceTracingtofalse. - To record cold startup time and warm startup time set
autoAppStarttotrue, check this section. - To record User Interaction set
enableUserInteractionTracingtotrue, check this section. - To enable assets instrumentation set
enableAssetsInstrumentationtotrue.
How to use
Just toogle environment flags (mentioned above) to enable/ disable monitoring.